CQC Governance Dashboards: What Your Leadership Team Needs on One Screen

Key Takeaways
One CQC quality statement is failed by more services than any other, and it is not about clinical care, staffing, or infection control. It is about governance. In GreenM's analysis of CQC's published assessment data, Governance, management and sustainability, the quality statement under the Well-led key question, is flagged as Requires Improvement or Inadequate in 45.4% of all assessed locations: 3,082 out of 6,784 services, more than 1,600 of them rated Inadequate. No other quality statement comes close; the next most-flagged, Medicines optimisation at 37.0%, is eight percentage points behind.
The question CQC inspectors ask when they assess governance is deceptively simple: how does your leadership team know what is happening across the organisation? The answer they expect is not "we have regular meetings" or "our managers report to the board." It is evidence: data, dashboards, audit trails, and trends showing that leadership has systematic oversight of safety, quality, performance, and compliance. Most providers answer with meeting minutes. Inspectors want dashboards.
Why is governance the hardest CQC quality statement to pass?
Governance is assessed differently from most other quality statements. It does not ask about a specific clinical process or a specific patient-facing interaction. It asks about the system that oversees everything else.
A provider can have good clinical care, adequate staffing, and satisfied patients, and still fail on governance if the leadership team cannot demonstrate how it knows those things are true. Governance is about the evidence of oversight, not the quality of care itself.
This is why it is the most commonly failed quality statement. Providers invest in clinical systems, training, and patient-facing services. They under-invest in the systems that make oversight visible. The result: care quality may be acceptable, but the ability to prove it, to an inspector, in real time, is not.
CQC narratives in flagged governance assessments use consistent language: audits were not effective in identifying shortfalls; systems did not always identify when incidents were not being reviewed; the provider had not always submitted notifications to CQC as required; records showed one person listed under two names on the rota, and twelve consecutive night shifts went unnoticed. The common thread is that leadership did not see the problem because the systems for seeing were not in place.
Which four metrics answer the CQC governance question?
An effective governance dashboard does not need to show everything. It needs to show the four things inspectors consistently ask about when assessing Well-led.
1. Open incidents by age
What it shows: how many incidents are currently open, how long they have been open, and how many are overdue against their investigation target.
Why it matters: CQC assesses whether incidents are investigated promptly and whether the organisation has a handle on its current risk profile. A dashboard showing 47 open incidents, 12 of them overdue, tells the inspector two things: the organisation knows where it stands, and it has a problem to address. A folder of Word documents tells the inspector nothing.
What Good looks like: all incidents are assigned, investigation targets are set, and the large majority close within target. Overdue items are visible and escalated.
What Outstanding looks like: the dashboard shows not just current status but trends, with investigation completion times improving quarter on quarter, driven by a specific process change the organisation can describe.
2. Action completion rate
What it shows: of all actions generated from incidents, complaints, audits, and governance reviews, how many are completed on time, how many are overdue, and how many are still open.
Why it matters: actions are where learning turns into change. Inspectors follow the trail from incident to investigation to action to outcome. If actions are logged but not tracked, the loop breaks. If actions are tracked and 78% complete on time, that is evidence of a functioning governance system.
What Good looks like: actions are tracked in a central register with owners, deadlines, and status, and the completion rate is monitored at governance meetings.
What Outstanding looks like: the organisation can show that action completion has led to measurable improvements, and can point to specific examples where an action prevented a recurrence.
3. Staffing adequacy: capacity versus demand
What it shows: whether there are enough qualified staff on each shift to meet the care needs of the people using the service. This is not a headcount; it is a comparison of what is needed, based on dependency levels, acuity, and care plans, versus what is deployed, based on rotas and actual attendance.
Why it matters: Safe and effective staffing is among the most-flagged quality statements, at 33.7% in GreenM's analysis of CQC data. It is also a governance issue, because CQC asks whether leadership monitors staffing adequacy and responds when it drops below safe levels. A governance dashboard that shows staffing data demonstrates that leadership sees and acts on the problem.
What Good looks like: a real-time or daily view of planned versus actual staffing, with alerts when thresholds are breached.
What Outstanding looks like: historical trend analysis showing staffing decisions are data-driven, with shift patterns adjusted based on analysis of peak demand and outcomes improving as a result.
4. Complaint and feedback resolution time
What it shows: average time from complaint or formal feedback received to resolution and response, broken down by category such as clinical, administrative, access, and communication.
Why it matters: CQC assesses whether the organisation listens to feedback and acts on it. Under the sector-specific frameworks in consultation, listening to and responding to feedback is set out as a named area of enquiry (CQC, Better regulation, better care consultation, 2025). Resolution time is a measurable proxy for organisational responsiveness.
What Good looks like: complaints are tracked with timestamps, categorised, resolved within a defined service level, and the complainant receives a documented response.
What Outstanding looks like: the organisation can show that complaint patterns led to systemic changes, not just individual resolutions, and that complaint volumes or categories shifted as a result.
What do these four metrics have in common?
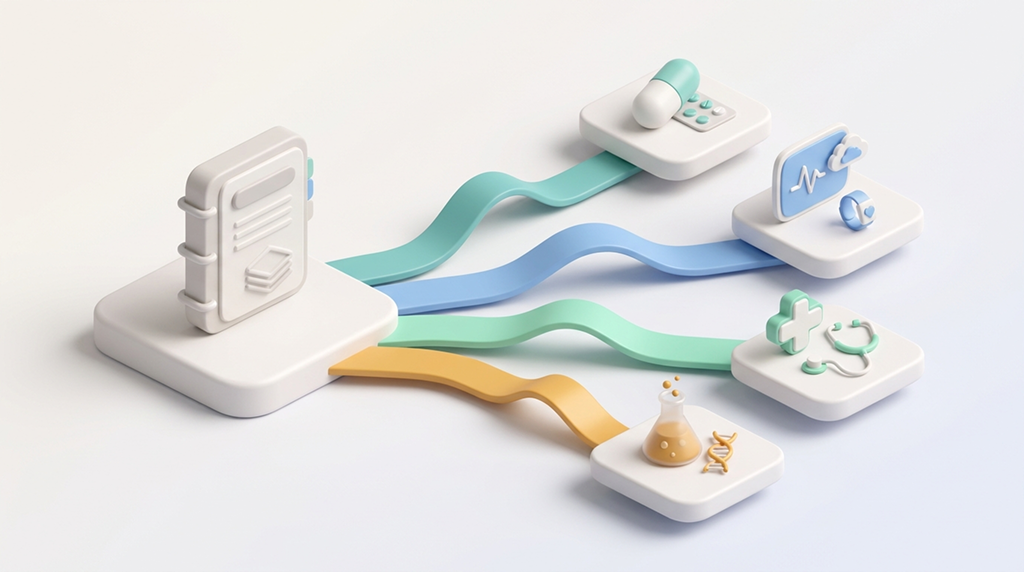
Each requires data from more than one system. Incident age needs the incident reporting system and the investigation tracker. Action completion needs the action register, which may live in a project tool, a spreadsheet, or a compliance platform. Staffing adequacy needs the HR system, the rota, and clinical acuity assessments. Complaint resolution needs patient feedback channels, the complaints log, and the actions taken in response.
No single system holds all of this. A governance dashboard that shows all four metrics in one view requires a data integration layer that connects these sources. This is why governance is the most commonly failed quality statement: it is the one that most depends on having your systems connected. You can deliver good clinical care with disconnected systems, though it is harder. You cannot demonstrate good governance without connected data, because governance is fundamentally about cross-system visibility.
How to build a CQC governance dashboard for healthcare providers?
A governance dashboard does not need to be built from scratch. The components are standard.
Data sources: most independent providers use some combination of Microsoft 365 (Lists, Forms, Planner), a practice management system (Semble, Cliniko, EMIS), an accounting system (Xero, QuickBooks), and an HR tool (BrightHR, HiBob, or a spreadsheet). These have APIs or export capabilities.
Data layer: an extract, transform, and load (ETL) pipeline that pulls data from source systems into a warehouse (Azure SQL, BigQuery, or a well-structured shared database) on a scheduled basis. Daily is sufficient for governance purposes.
Reporting: Power BI, Looker Studio, or Tableau connected to the warehouse. Four views, for incidents, actions, staffing, and feedback, plus one overview that combines the key metrics.
Governance workflow: the dashboard feeds the governance meeting; the meeting generates actions; the actions feed back into the dashboard. The loop is closed. The technical complexity is moderate. The organisational decision to do it is the harder part.
What does this mean for CQC ratings?
The pattern in GreenM's analysis of CQC data is stark. Well-led has the highest rate of Requires Improvement and Inadequate ratings, at 38.4%. Only 1.8% of services achieve Outstanding on Well-led. Governance is the single most-flagged quality statement, at 45.4%.
The organisations that pass governance are the ones that can show an inspector a screen, not a folder, that demonstrates systematic oversight. The ones that achieve Outstanding can show the screen and then explain how the data led to a specific decision that improved outcomes. A governance dashboard is not a nice-to-have. It is the minimum evidence infrastructure for the most commonly failed CQC standard.
Frequently asked questions
What is a CQC governance dashboard?
It is a single view that brings together the metrics CQC inspectors ask about under the Well-led key question, typically open incidents by age, action completion rate, staffing adequacy, and complaint resolution time, drawn from a provider's existing systems into one screen.
Why is governance the most-flagged CQC quality statement?
Because it depends on cross-system visibility. In GreenM's analysis of CQC data, Governance, management and sustainability is flagged in 45.4% of assessed locations, as leadership cannot demonstrate oversight when incidents, staffing, finance, and feedback live in separate systems.
Which metrics should a CQC governance dashboard show?
Four answer the inspector's core question: open incidents by age, action completion rate, staffing adequacy (capacity versus demand), and complaint and feedback resolution time. Each maps directly to a Well-led line of enquiry.
How do you build a CQC governance dashboard for healthcare providers?
Start with the four metrics inspectors ask about — open incidents by age, action completion rate, staffing adequacy, and complaint resolution time — then connect the systems that hold each: incident tracker, action register, HR/rota, and complaints log. A daily ETL feeds a warehouse; Power BI, Looker Studio, or Tableau renders the four views plus one overview. The governance meeting closes the loop, generating actions that feed back into the dashboard.
Do meeting minutes count as governance evidence for CQC?
They help, but they are not enough on their own. Inspectors look for current, structured data and trends that show leadership has continuous oversight, rather than a narrative compiled after the fact.
What turns a Good governance rating into Outstanding?
Showing that the data drove a decision. Outstanding services point to a specific case where dashboard trends prompted a change, such as adjusting shift patterns, and where outcomes measurably improved as a result.
Governance is the most-flagged CQC quality statement, and 45.4% of locations do not meet the standard. GreenM builds governance dashboards from your existing systems, bringing incidents, staffing, feedback, and actions onto one screen. Book a CQC data audit to see what your governance view should look like.