Exploring 7 free BI tools for smart decision-making

Who owns the information, he owns the world. Is it so to run your business progressively? To own and grow your business, just owning the information is not enough. At GreenM, we say: “Who makes use of actionable insights received from raw data, he owns the business and world.” Here goes Business Intelligence (BI), Artificial Intelligence, and Data Analytics.
Some interesting figures: According to the report by Finances Online, 64% of users reported that BI data and analytics helped improve their efficiency and productivity. Meanwhile, 56% believe it has allowed them to make more effective decisions faster and 51% think it has led to better financial performance. More than 46% of businesses are already using a BI tool as a core part of their business strategy.

Leveraging free BI tools not only facilitates smarter decision-making but also fosters a culture of continuous improvement and agility within organizations. As technology continues to advance, so too does the complexity and volume of data generated. In this article, you will learn about 7 free BI tools, offering practical insights and guidance to help businesses navigate the intricacies of data analytics and unlock their full potential in driving informed decision-making and sustainable growth.
How come a BI tool is the best BI solution to help you handle data?
While BI is most impacted by big data, cloud infrastructure, the Internet of Things, AI, and machine learning, BI itself provides ways of dealing with data in a sophisticated manner, and ultimately refining raw data into dollars. Let’s take a look at these data operations:
- Data integration: BI tools allow users to integrate data from multiple sources, including databases, spreadsheets, cloud applications, and APIs. This process involves combining data from disparate sources into a unified format for analysis.
- Data cleaning and transformation: Before analysis, data often requires preparation, cleaning, and transformation to ensure accuracy and consistency. BI tools offer features for cleaning, filtering, and transforming data, such as removing duplicates, handling missing values, and standardizing formats.
- Data modeling and analysis: BI tools provide capabilities for creating data models and performing advanced analytics. Users can build relationships between datasets, create calculated fields, and apply statistical functions to analyze trends, patterns, and correlations within the data.
- Data visualization: Visualization is a key aspect of BI tools, allowing users to represent data visually through charts, graphs, maps, and other graphical elements. Visualization enhances understanding and facilitates communication of insights to stakeholders.
- Dashboard creation: BI tools enable users to create interactive dashboards that consolidate and display key metrics and KPIs in a visually appealing format. Custom dashboards provide a centralized view of business performance and help stakeholders monitor progress toward goals.
- Report generation: BI tools facilitate report generation by allowing users to create custom reports based on specific criteria and parameters. Reports can be scheduled for automatic generation and distribution, ensuring timely delivery of insights to stakeholders.
- Predictive analytics: Some advanced BI tools offer predictive analytics capabilities, allowing users to forecast future trends and outcomes based on historical data. Predictive models can help organizations anticipate changes and make proactive decisions.
- Data mining: BI tools support data mining techniques to discover hidden patterns, relationships, and insights within large datasets. Data mining algorithms can identify anomalies, outliers, and trends that may not be immediately apparent through manual analysis.
- Data governance and security: BI tools provide features for data governance and security, allowing organizations to enforce policies, manage access permissions, and ensure compliance with regulatory requirements. Data encryption, user authentication, and audit trails are common security features.
That is how having a BI tool is helpful. As a part of our data engineering and BI & data analytics services, we deal with any data operations, tool-related issues, including optimization and customized solutions, and more. So, you can ask any question to that end by emailing at hello@greenm.io or booking a meeting with us.
Free BI tools list
Some more interesting figures: According to Statista, leading vendors’ share of the best business intelligence tools market worldwide in 2023 was as follows: Mode 24.43%, Tableau 13.17%, Power BI 12.42%, Microsoft SQL Server Reporting 5.49%, and SAP Crystal Reports 4.2%.
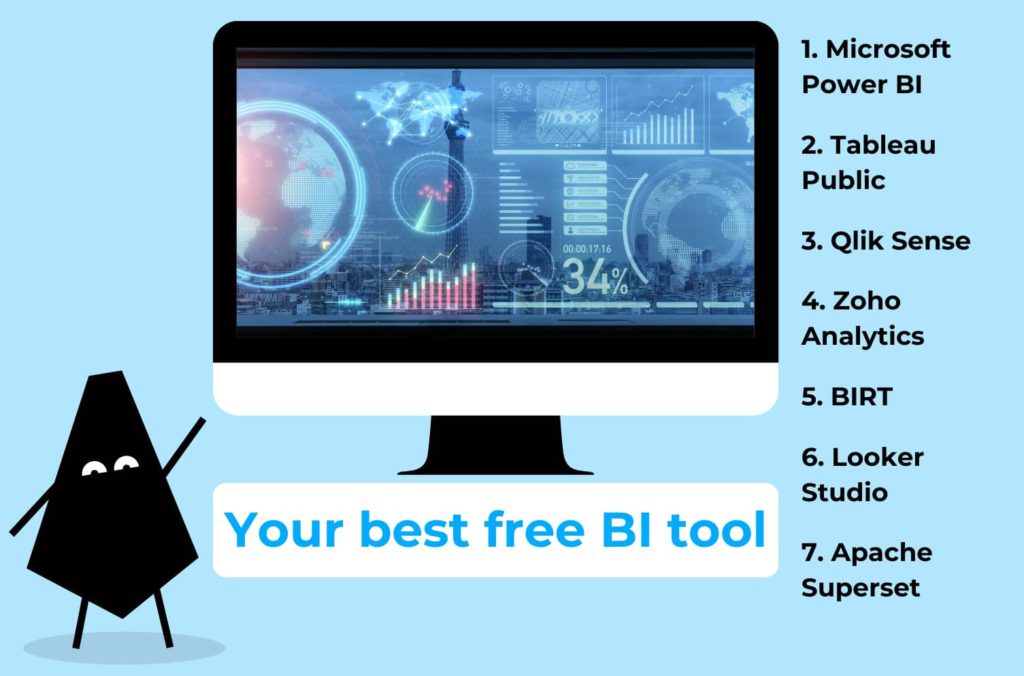
Based on these top self-service bi tools, we have searched for free business intelligence tools, as alternatives, and selected the most suitable for you. After BI tools comparison, you will be able to choose the one you like.
- Microsoft Power BI: Microsoft Power BI is a powerful BI tool that offers a free version with limited features, making it accessible to small businesses and individuals. With its intuitive interface and robust features, Power BI allows users to connect to a variety of data sources, including Excel spreadsheets, SQL databases, and cloud services such as Azure and Salesforce. One of the key strengths of Power BI is its extensive library of pre-built visualizations and custom visualization options, allowing users to create compelling reports and dashboards. Additionally, Power BI offers AI-powered features such as natural language processing (NLP) and predictive analytics, enabling users to gain deeper insights from their data.
Key features:
- Extensive data source connectivity: Connects to a wide range of data sources, including Excel, SQL databases, and cloud services.
- Pre-built visualizations: Offers a library of pre-built visualizations and custom visualization options.
- AI-powered insights: Utilizes AI and machine learning for natural language processing and predictive analytics.
- Data modeling: Allows users to create relationships and hierarchies within their data for more advanced analysis.
- Tableau Public: Tableau Public is a free version of Tableau’s popular BI software that allows users to create and share interactive data visualizations online. While Tableau Public has some limitations compared to its paid counterpart, it still offers a robust set of features for data exploration and analysis. With Tableau Public, users can connect to a variety of data sources, including Excel, CSV files, and cloud databases, and create visually stunning dashboards and reports using a drag-and-drop interface. One of the unique features of Tableau Public is its ability to publish visualizations to the Tableau Public gallery, allowing users to share their work with the broader community and gain exposure.
Key features:
- Interactive data visualizations: Allows users to create interactive dashboards and reports with a drag-and-drop interface.
- Data source connectivity: Connects to a variety of data sources, including Excel, CSV files, and cloud databases.
- Tableau Public gallery: Enables users to publish visualizations to the Tableau Public gallery for sharing and collaboration.
- Community engagement: Facilitates collaboration and knowledge sharing within the Tableau Public community.
- Qlik Sense: Qlik offers a free version of QlikView for personal use or a 30-day free trial of Qlik Sense. It is a leading BI and data visualization platform known for its associative analytics engine, which allows users to explore data dynamically and uncover hidden insights. With Qlik Sense, users can easily create interactive dashboards and reports using drag-and-drop functionality, enabling them to visualize data and gain actionable insights quickly. The platform supports a wide range of data sources, including databases, spreadsheets, and cloud applications, and offers powerful data integration and transformation capabilities. Qlik Sense also provides advanced analytics features, such as predictive modeling and natural language processing, to help users uncover patterns and trends in their data.
Key features:
- Associative analytics engine: Enables dynamic exploration of data relationships and associations.
- Drag-and-drop interface: Allows users to create interactive dashboards and reports without coding.
- Data integration and transformation: Supports integration with various data sources and offers robust ETL capabilities.
- Advanced analytics: Provides predictive modeling, natural language processing, and other advanced analytics features.
- Zoho Analytics: Zoho offers a free on-premise personal plan or a 15-day free trial cloud version. Zoho Analytics is a comprehensive BI and analytics platform that offers a wide range of features for data analysis and visualization. With Zoho Analytics, users can connect to multiple data sources, including databases, cloud applications, and files, and create insightful dashboards and reports using a drag-and-drop interface. The platform provides advanced analytics capabilities, such as predictive analytics and what-if analysis, allowing users to gain deeper insights into their data. Zoho Analytics also offers collaboration features, enabling teams to work together on data analysis projects and share insights with stakeholders.
Key features:
- Multiple data source connectivity: Connects to databases, cloud applications, and files for comprehensive data analysis.
- Drag-and-drop interface: Enables easy creation of dashboards and reports without coding.
- Advanced analytics: Provides predictive analytics, what-if analysis, and other advanced analytical capabilities.
- Embedded analytics: Offers embedded analytics capabilities for integrating analytics into third-party applications and websites.
- BIRT (Business Intelligence and Reporting Tools): It is a free, open-source reporting system built on Eclipse and reporting toolset that provides a powerful business intelligence platform for creating and deploying custom reports and dashboards. Developed by the Eclipse Foundation, BIRT offers a wide range of features for data visualization, including charts, graphs, and tables, as well as advanced reporting capabilities, such as scheduling and distribution. The platform supports integration with various data sources, including databases, XML files, and web services, and provides extensive customization options for designing reports and dashboards. BIRT is widely used by developers and organizations to create interactive and visually appealing reports and dashboards for business users.
Key features:
- Custom report and dashboard creation: Enables developers to create custom reports and dashboards with rich visualizations.
- Integration with data sources: Supports integration with databases, XML files, web services, and other data sources.
- Advanced reporting capabilities: Provides scheduling, distribution, and customization options for reports.
- Open-source and extensible: Offers an open-source platform that can be extended with custom plugins and extensions.
- Google Data Studio (now Looker Studio): Google Data Studio is a free BI tool offered by Google that enables users to create interactive dashboards and reports using data from various sources. You can set it up and create reports for $0 but only if you use data from Google products. As part of the Google Analytics 360 Suite, Data Studio integrates seamlessly with other Google products such as Google Analytics, Google Ads, and Google Sheets, making it a convenient choice for businesses already using Google’s ecosystem. With its drag-and-drop interface, users can easily create customized dashboards with a variety of visualizations, including charts, graphs, and tables. Data Studio also allows for collaboration, enabling multiple users to view and edit reports in real-time.
Key features:
- Integration with Google products: Seamlessly integrates with Google Analytics, Google Ads, and Google Sheets.
- Drag-and-drop interface: Makes it easy to create customized dashboards and reports without coding.
- Real-time collaboration: Enables multiple users to collaborate on reports in real time.
- Data source connectors: Supports a wide range of data sources, including Google Cloud SQL, MySQL, and PostgreSQL.
- Apache Superset: Apache Superset is another free open-source BI tool that offers a wide range of features for data exploration and visualization. Developed by Airbnb, Superset is designed to be highly scalable and performant, making it suitable for organizations dealing with large volumes of data. One of the standout features of Superset is its extensive library of visualizations, including charts, graphs, and geospatial maps. Additionally, Superset integrates seamlessly with popular data sources such as MySQL, PostgreSQL, and Druid, allowing users to analyze data in real time. With its intuitive interface and powerful features, Apache Superset is a compelling option for businesses looking for a free BI tool.
Key features:
- Scalability: Designed to handle large volumes of data and high concurrency.
- Rich visualization library: Offers a wide range of visualizations for exploring and presenting data.
- Real-time analysis: Integrates with Druid for real-time data exploration and analysis.
- SQL lab: Allows users to write and execute SQL queries within the application.
Conclusion: It is worth using business intelligence products, especially if it is BI tools free
While there are many BI tools available in the market, businesses don’t necessarily have to break the bank to access powerful analytics and insights. The seven free BI tools discussed in this article offer a range of features and capabilities to meet the needs of small businesses, individuals, and organizations operating on a tight budget. Whether you’re looking for an intuitive query builder, extensive data source connectivity, or advanced AI-powered analytics, there’s a free BI tool out there that can help you make smarter decisions and drive business growth.
Any questions left? Contact us, we will help you find the answers to your problems whether they are related to any data issues, business intelligence tools comparison, or custom business intelligence platform.

