Developing Self-Service Analytics for Telehealth

Telehealth is a trendy solution for modern healthcare IT companies. In the previous article we talked about how self-service analytics can help telehealth solution providers, including higher security and lower costs, workflow integration, patient benefits and long-term use prospects. The next logical step is to define how to make self-service analytics a reality in your company.
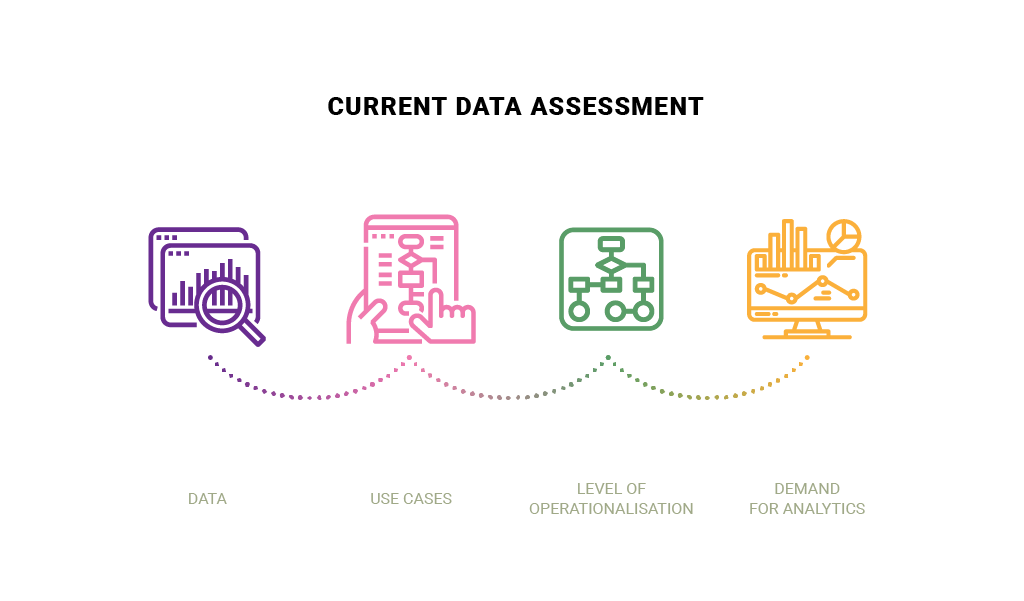
Start with a current state assessment
Assessment of the current state is an important part of every new initiative. It helps you understand your business and data environment, as well as to better understand your analytics needs. Specifically for self-service analytics, you should document the data structure, models, quality standards, as well as metadata architecture. The following aspects are of critical importance:
- Where is your data?
- What are the typical use cases when employees need access to the data? Who are the stakeholders for these use cases?
- What is the level of operationalization for these use cases? Do engineering and IT actively support access to the data by employees?
- Is there a demand for analytics from top management?
It is best to look at an example of such assessment for a better understanding of what we are dealing with and how it all should look. From our experience at GreenM working with healthcare and pharma companies, a common scenario looks like this:
Data is located in operational data stores like Relational Database Management System or RDBMS (MS SQL, My SQL, PostgreSQL, etc.) and/or NoSQL databases (MongoDB, Couchbase, etc.). The sales team and production monitoring team are the main consumers of the data internally, while the most common data use cases are:


For sales/marketing: Run queries on operational data store manually to extract data in .CSV format and build platform utilization reports in Excel for internal reporting.


For production monitoring/customer support: Run queries on the operational data store in an automated manner to monitor platform workflows.


The level of operationalization is low. The engineering team is focused on the delivery of the platform-related features. While being partially automated for the production monitoring, data access cases are not a part of the platform.


The main focus of top management is to sustain growth. Analytics is seen as the next strategic step for platform development.
Current state assessment helps identify the “low-hanging fruit” minimum viable product (MVP) for a self-service analytics initiative (platform utilization reports for sales, marketing, customer support), minimum set of data sources for self-service analytics MVP, and MVP stakeholders.
Current state analysis is one of the steps that sets the flow of action for all development processes, therefore leaving a gap here could be quite costly. Things to look out for:
Documentation divide. The divide happens when documentation does not respond to actual processes or the reality of how the stakeholders interact with each other.
Understanding of integration. It is important to understand both direct and indirect integration points. In this way, future changes do not break the existing systems of relationships between departments, user-software or software parts themselves.
Denial of issues. The fear of talking about a problem is a clear barrier towards building a better product. First, acknowledging that a problem exists, then measuring and documenting it closely are by far more productive in the process of improvement.
Common mistakes

“We just need a good visualization tool”
The market of business intelligence (BI) tools supporting self-service analytics is overloaded. You can find any kind of tool to support your needs: SaaS web tools, desktop standalone tools, desktop with a centralized server to publish content, and desktop with SaaS Web centralized storage. Additionally, these tools provide low onboarding barriers by providing support for various data sources including flat files (.CSV, Excel, etc.). It makes users think that there is instant value by including such tools into existing processes – a couple of clicks and a beautiful dashboard with a pie chart is ready.
Read also: Boosting Telehealth Solutions with Self-Service Analytics
However, this first impression evaporates very quickly when users must wait for weeks or transform vast amounts of data manually before loading it to the ready-made BI tools. Powerful BI tools can make a difference, but only when data preparation processes have been optimized.

“Self-service analytics is easy”
Another frequently seen example looks like this: the company has a good enough source of data that does not require manual steps to pre-process the data. Usually, such a data source is some sort of operational storage for an existing production system. Users (such as sales, operations, products) jump-start building dashboards. As a result, performance suffers, and dashboards aren’t as expressive as users want them to be. This happens either because the underlying data source was not built for analytical purposes, or because its resources are not enough to fulfill growing BI utilization. The issue with unsophisticated, inexpressive dashboards happens due to the lack of specialized training on data storytelling and/or favorite BI tools.
Lack of specific knowledge results not only in hard-to-read dashboards but also makes performance issues even worse due to suboptimal queries.
Actively involve IT/Engineering to prepare the data sources properly and refine the data preparation processes. Train first users of the BI tool to get the most out of the data.

“It is self-service, so why bother about governance?”
In case your data source is in good shape and users were trained specifically for the BI tool and visualization techniques, then it might seem that everything is set up for success. It is true. At this point, the company is set up to provide real value to the consumers of the BI tool. But this process is not sustainable yet, because the governance piece is missing. The governance in self-service analytics is required in two major domains: data preparation and schema management and dashboard publishing.
Consider the following scenario:
- Self-service analytics works well, and adoption is high, so users create a lot of dashboards to cover all requests from consumers (internal and external).
- As time goes by, the number of dashboards grows to the extent that it is now hard to identify what story the dashboard tells and whether data is still accurate.
- Underlying data source schema changes and there is a task to identify dashboards that are still functional and the ones that are broken.
With proper governance in place, these challenges can be solved without interrupting the BI value chain.

“We have no time to talk to all of the stakeholders. We need dashboards now!”
This mistake is typical not only to self-service analytics projects but to many internally focused projects as well. When a team builds something for internal use, it always seems that they already know what their users want or that internal users are not as demanding as their customers. As a result, the team jumps into the implementation and creates something that does not result in high adoption, mostly because this result is not expected by internal users. Nobody talked to them, nobody asked their opinion, so now the team must “sell” what is already created to get the adoption rate.
Read also: The Anatomy of a Data-Driven Patient Engagement Platform
A much better strategy would be to focus on one specific output for a small group of internal users and involve representatives from that group in the discussion of the project requirements, visuals design, and intermediate demos. This iterative approach and early involvement of the users results in much higher adoption rates, so it mitigates one of the biggest risks of the self-service analytics project.
Self-service analytics as a software project: Iterative approach
A self-service analytics project is a software delivery project, so it is an investment which must correspond to the common structure of how such projects are made:
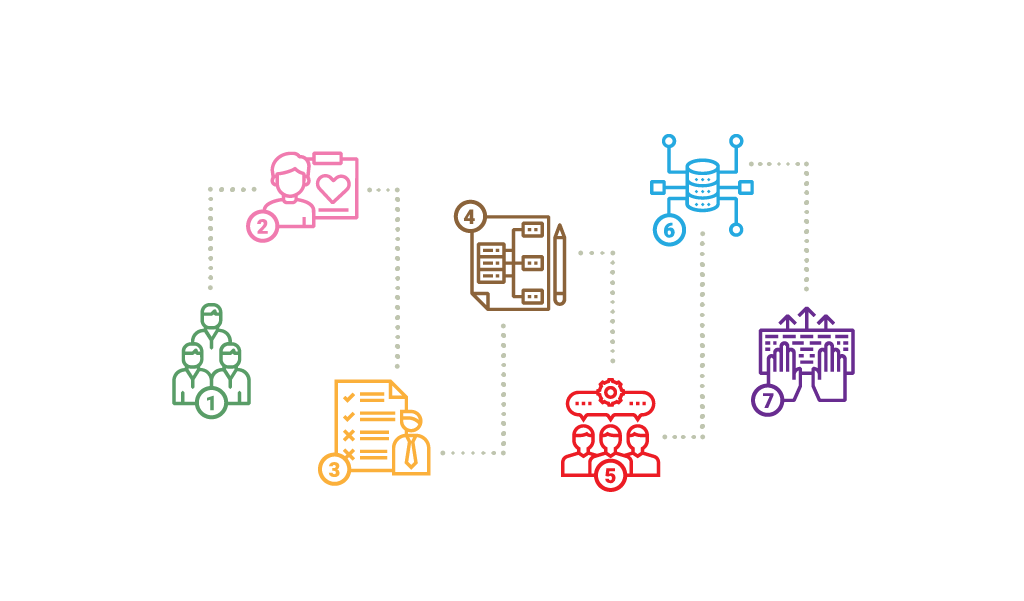
- Build a delivery team.
- Find the end-users and their needs.
- Define requirements backlog.
- Design architecture.
- Define collaboration processes.
- Setup and monitor infrastructure.
- Deliver on a regular basis.
An iterative approach is a key to success
An iterative approach is a powerful tool to fulfill users’ needs keeping budget, schedule, and risks under control. The key levers of the iterative approach are focus and early feedback.
A self-service analytics project can utilize an iterative approach through development of self-service analytics expertise. The project can start with a fairly small team of 2-3 BI enthusiasts with high motivation to learn new technologies and techniques. This team will grow to the team of experts capable of scaling the self-service analytics adoption inside the company. The growth of the self-service analytics team should be iterative with the balance between the delivery and new team members’ training.
Read also: Implementing Telemedicine Software During COVID-19
Adoption of self-service analytics is another point that is covered by the iterative approach. It is hard to change the ways people have been performing their duties for years. You should not rely on convincing them with explanations and beautiful visualizations. People usually learn better by example. Even a small, successful adoption of the self-service analytics output in operations can make the biggest skeptics adopt a new way.
Start a self-service analytics project with very clear KPIs and eventually it will improve. Ideally, choose the low-hanging fruit to eliminate technical maturity risks. Extend the adoption by delivering to the uncovered audience.
Next steps
Move towards a value-driven organization
High adoption of self-service analytics throughout the company means that operations, sales, marketing, products, and other consumers of the analytics now spend their time focusing on business growth, customer satisfaction, platform stability, etc.
Data feed becomes the blood of the organization because now the company does not only collect massive amounts of the data (data-driven), but also extracts business value out of it. The company becomes value-driven.
The data platform as a key piece for data strategy
A company that introduces self-service analytics in an iterative way comes to the point when a data platform is a necessity. The introduction of the data platform is an inevitable next step to uncover advanced data value extraction methods like ML and AI.
Read also: The GreenM Healthcare Data Platform Framework
In conclusion
Developing self-service analytics is an investment for companies, but one that helps uncover great results and brings business value.
The first step is to perform a current state assessment, closely monitoring and recording the existing processes within the organization, and specifically defining data structure, data flow, use cases and demand for self-service analytics for departments and top management.
There are numerous pitfalls that may zigzag your decision. Thinking that ready-made BI tools will work universally is often just as misleading as rushing your development process without considering all the stakeholders involved.
Self-service analytics is a software, and its project should be treated as such. Building a delivery team, defining the requirements, designing architecture, and setting up and monitoring infrastructure and delivery continuously are a must.
PARTNER UP WITH DATA EXPERTS
We help to deliver self-service telehealth solutions to address questions and issues relevant to your business needs.
Development of expertise and adoption within the organization are interlinked processes, one of which follows another.
What’s next? Data- and value-driven companies are highly important in modern healthcare business, and developing a well-made analytics process is key for that. With increasing amounts of data collected, a data platform is a good strategy to encompass a wide range of data-related needs.
Want to know more? Top 5 handpicked healthcare industry insights, cases and business recommendations in your inbox every two weeks. Hit the SUBSCRIBE button below to learn about health tech with our digest!
LEARN HOW TO CREATE ADVANCED BUSINESS INTELLIGENCE SYSTEM
How to get system logs from all clients and build comprehensive analytics to track usage, device failure and performance.